No products
Product successfully added to your shopping cart
There are 0 items in your cart. There is 1 item in your cart.
Boonton RF Power Meters
- EMC Test Equipment
- Transient Generators
- RF Power Amplifiers
- DC - 300 kHz RF Amplifiers
- 10 kHz - 250 MHz RF Amplifiers
- 10 kHz - 400 MHz RF Amplifiers
- 10 kHz - 1 GHz RF Amplifiers
- 80 MHz - 1 GHz RF Amplifiers
- 1 GHz - 2 GHz RF Amplifiers
- 700 MHz - 4.2 GHz RF Amplifiers
- 1 GHz - 6 GHz RF Amplifiers
- 2 GHz - 8 GHz RF Amplifiers
- 6 GHz - 18 GHz RF Amplifiers
- 18 GHz - 40 GHz RF Amplifiers
- Pulse Amplifiers
- RF Field Strength Probes & Meters
- RF Conducted Immunity
- EMC Receivers/EMI Analyzers
- EMC Antennas
- Coupling Decoupling Networks (CDN's)
- Line Impedance Stabilization Networks (LISN's)
- RF Test Equipment
- EMC Probes
- EMC Measurement & Equipment Software
- Power Supplies
- Electrical Safety Analyzers
- High Precision Laboratory Power Analyzers & Meters
- Anechoic Chambers
- Over-the-Air (OTA) Test Chambers
- EMI RF Shielded Tent Enclosures
- RF Shielded Rooms
- EMC Absorber
- Positioning Equipment
- EMC/EMI Test Setup
- GTEM Cells / TEM Cells
- Reverberation Chambers
- Used RF Anechoic Chambers
- EMC Chamber Filters
- EMC Chamber Shielding Gaskets
- RF Shielded Doors
- Anechoic Chamber Accessories
- Fully Anechoic (FAR) Test Chambers
- Manufacturers
- 3ctest
- AE Techron
- AH Systems
- Amplifier Research
- Boonton
- Com-Power
- Diamond Engineering
- EM Test (Ametek CTS)
- EMC Partner
- EMC Test Design
- Empower High Power RF Amplifiers
- ETS-lindgren
- Log Periodic Dipole Array Antenna
- Near Field Probe Sets
- Double Ridge Horn Antennas
- Biconical Antennas
- Quad Ridge Horn Antennas
- Electric Field Probes
- GTEM's
- Positioners & Tripods
- Loop Antennas
- Biconilog Antennas
- LISN's (Line Impedance Stabilization Network)
- Shielded Enclosures/Rooms
- Monopole Antennas
- Field Generating Antennas
- Fischer Custom Communications
- Haefely Hipotronics
- Haefely EFT/Burst Immunity Test Systems
- Haefely Surge Combination Wave Test Systems
- Haefely Surge Damped Oscillating Wave Test Systems
- Haefely Electrostatic Discharge Test Systems (ESD)
- Haefely Surge Ring Wave Test Systems
- Haefely Surge Telecom Wave Test Systems
- Haefely Magnetic Field Test Systems
- Haefely CDN's (Coupling/Decoupling Networks)
- IFI Amplifiers
- Keysight (Agilent)
- MVG - Microwave Vision Group
- PMM / Narda
- Rohde & Schwarz RF Test Equipment
- Rohde & Schwarz Broadband RF Amplifiers
- Rohde & Schwarz Spectrum Analyzers
- Rohde & Schwarz Compliant EMI Test Receivers
- Rohde & Schwarz Isotropic RF Probes
- Rohde & Schwarz RF Signal Generators
- Rohde & Schwarz RF Switches
- Rohde & Schwarz Oscilloscopes
- Rohde & Schwarz RF Power Meters
- Rohde & Schwarz RF Power Sensors
- Schloder
- Schwarzbeck Mess-Elektronik
- Schwarzbeck Antennas
- Schwarzbeck Automotive Antennas
- Schwarzbeck Broadband Horn Antennas
- Schwarzbeck Biconical Antennas
- Schwarzbeck Logarithmic Periodic Broadband Antennas
- Schwarzbeck Stacked Log-Periodic Broadband Antennas
- Schwarzbeck Biconic Log-Periodic Antennas
- Schwarzbeck Dipole Antennas
- Schwarzbeck Rod Antennas
- Schwarbeck Antenna Baluns / Holders
- Schwarzbeck LISN Line Impedance Stabilisation Networks
- Schwarbeck Decoupling & Absorbing Clamps
- Schwarzbeck Field Probes
- Schwarzbeck Helmholtz Coils
- Schwarzbeck Antenna Masts
- Schwarzbeck Coupling/Decoupling Networks
- Schwarzbeck Antennas
- Solar Electronics
- Teseq (Schaffner)
- Teseq Automotive Transient Generators
- Teseq RF Test Equipment
- Teseq EFT/Burst Generators
- Teseq RF Immunity Generators
- Teseq ESD Guns
- Teseq Surge Generators
- Teseq Harmonics & Flicker Solutions
- Teseq Dips, Interrupts & Variations Equipment
- Teseq Ring Wave Generators
- Teseq Oscillatory Waves Generators
- Teseq Absorbing Clamps / Ferrite Tube
- Teseq EMC Antennas
- Teseq Current Probes
- Teseq Coupling Networks
- Thermo Keytek
- Vicreate
- Compliance Standards
- International (IEC/EN)
- EN/IEC 61000-3-2
- EN/IEC 61000-3-3
- IEC 61000-3-11
- IEC / EN 610000-3-12
- EN/IEC 61000-4-2
- EN/IEC 61000-4-3
- EN/IEC 61000-4-4
- EN/IEC 61000-4-5
- EN/IEC 61000-4-6
- EN/IEC 61000-4-7
- EN/IEC 61000-4-8
- EN/IEC 61000-4-9
- EN/IEC 61000-4-10
- EN/IEC 61000-4-11
- EN/IEC 61000-4-12
- EN/IEC 61000-4-16
- EN/IEC 61000-4-18
- EN/IEC 61000-4-19
- EN/IEC 61000-4-20
- EN/IEC 61000-4-21
- EN/IEC 61000-4-29
- EN/IEC 61000-4-31
- IEC 61000-4-39
- EN/IEC 62132
- SEMI F47 Voltage Sag Immunity
- Product Standards
- Military & Aerospace Standards
- Automotive EMC Standards
- CISPR Standards
- Telecom Testing
- ANSI/IEEE Standards
- FCC Part 15
- FCC Part 30
- International (IEC/EN)
- Application/Test Type
- Radiated Immunity
- Bulk Current Injection Testing
- RF Emissions Testing
- Conducted Immunity
- Conducted Emissions
- Antenna Pattern Measurement
- CE Mark Testing
- Intentional Radiator Testing
- Pulsed HIRF Radar
- Over-the-Air (OTA) Testing
- 5G Test Solutions
- Automotive EMC
- SAR Measurement Equipment
- Radiated Emissions
- Battery Simulator Test Equipment
- Services
- Clearance
Viewed products
-

Boonton 4500A RF Peak...
>60-dB dynamic range Frequency...
 View larger
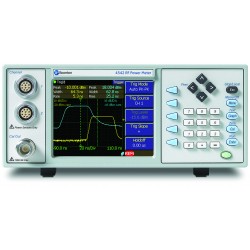
Boonton 4500A RF Peak Power Meter/Analyzer
New
- >60-dB dynamic range
- Frequency range: 30 MHz to 40 GHz
- Dual-channel CDF/PDF
- 1-GHz NIST Traceable Calibrator
- Synchronous/asynchronous measurements
- Color VGA display
- PC-compatible 1.44-MB floppy
PDF Downloads
Test Equipment Description
4500A RF Peak Power Meter/Analyzer
For analyzing RF signals with digital modulation, multiple carriers or today’s complex coding techniques, the Boonton Model 4500A yields the answers that designers and manufacturers of state-of-the-art wireless communications systems demand. Hard-tomeasure HDTV and spread-spectrum signals like CDMA and WCDMA are now easy to view and analyze, thanks to the innovative capabilities of the Model 4500A.
Along with all the time-domain measurements of Boonton’s Model 4400A, the Model 4500A adds a host of statistical measurements that are made on a continuously sampled RF signal. Adding the second input channel to these capabilities allows you to monitor two sources, such as input and output power, simultaneously. Powerful math functions can be used to analyze the differences between channels, making difficult measurements like output stage compression and intermodulation distortion easy to identify and to correct.

Time-domain waveform of 8 carriers spaced 700 kHz apart from
1.8 GHz to 1.8049 GHz and phase aligned for highest peak power.
MODEL 4500A ADDS STATISTICAL MEASUREMENTS CAPABILITY
Many modern communications systems use modulation methods that result in pseudorandom or noise-like signals. Examples of this are CDMA, WCDMA, multi-carrier, HDTV, and DAB. The traditional methods of RF power measurement are not adequate for these systems. A CW power meter can measure the average power of these signals provided care is taken not to overload the sensor or operate above the linear power region for diode sensors. Since the peak power can be 16 dB higher than the average power and these peaks are often compressed by amplifiers and other components of the communication system, some method is needed to measure the peak power as well as the average power. The Pulse Measurement mode described above can measure peak power over relatively short time intervals as required for time-based systems. However, CDMA, in particular, requires the measurement of infrequent power peaks over long time periods. It is also necessary to know how often various power levels occur as a percentage of the total run time.
This is achieved by calculating a cumulative distribution function (CDF) from a large number of power measurements. The Model 4500A can accumulate 500,000 power readings per second from one channel and internally create a histogram containing 4,096 discrete power levels of better than 0.02-dB resolution. Each power level bin is a 31-bit counter that records the number of occurrences of the corresponding power level. This process can be performed for two channels simultaneously at a rate of 250,000 power readings per second.
The histogram data is displayed as a cumulative distribution function (CDF) or a complementary cumulative distribution function (CCDF) for each channel. CCDF is also referred to as 1-CDF. A statistical measurement begins by clearing the histogram array to zero and resetting the elapsed time and sample counters. The measurement can be allowed to continue until one of the count bins fills to the maximum allowable number of counts: 2,100,000,000. At the maximum sampling rate, the running time exceeds one hour. The advantage of this method is that even a single occurrence of the highest power level during the running time will be recorded and appear on the distribution function display
SOPHISTICATED SIGNAL PROCESSING FOR FAST, AUTOMATIC MEASUREMENTS
Both the Models 4400A and 4500A have a dedicated floating point digital signal processor that performs shaping, filtering, calibration, offset compensation, and conversion of the test signal. Random repetitive sampling and selectable averaging provide accurate, stable measurements of all user-programmed waveform parameters. Digital signal processing permits pre-trigger information. Logarithmic detection provides the best dynamic range of 60 dB (-40 to +20 dBm) for peak power measurments.
Measurements are fast…two marker values and their delta are available 80 times per second over the bus, and all 14 automatic measurements are available 20 times per second.
SETUP & WAVEFORM STORAGE
Up to 10 complete panel setups can be stored and recalled from internal memory for applications in which the same instrument setups are used repetitively. For permanent hard-copy documentation, complete display data can be transmitted to a plotter or printer via an RS-232 serial, IEEE-488 port, or LPT port, supporting LaserJet, ThinkJet, and HPGL formats.
COLOR DISPLAY
The display is a VGA-compatible seven-inch diagonal color CRT with a resolution of 640 x 480 pixels. Waveforms are displayed at 501 x 281 resolution.
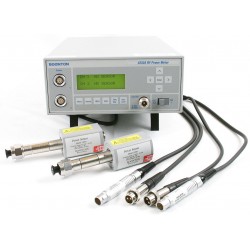
PEAK POWER SENSORS TO MATCH YOUR APPLICATION
Boonton Electronics offers a wide selection of sensors that are optimized for different characteristics such as frequency, risetime, and dynamic range.
All sensors feature a balanced diode configuration for high sensitivity and eveorder harmonic suppression. Low VSWR minimizes mismatch errors. Calibration factors traceable to NIST standards are stored in EEPROM, and an internal temperature sensor tracks temperature change. Calibration factor information and other sensor data are automatically downloaded to the instrument when the sensor is connected.
PRECISION 1-GHz CALIBRATION FOR PERFORMANCE VERIFICATION
A spectrally pure, 1-GHz NIST traceable calibrator guarantees measurement reliability. The userselectable automatic routine calibrates the sensor and instrument over the full dynamic range of the instrument. An output of –40 to +20 dBm (CW or pulsed) makes this a versatile source.
DISK DRIVE
The display is a VGA-compatible seven-inch diagonal color CRT with a resolution of 640 x 480 pixels. Waveforms are displayed at 501 x 281 resolution.
CUMULATIVE DISTRIBUTION FUNCTION (CDF)
The Model 4500A CDF is a plot of power on the vertical axis versus probability on the horizontal axis. The logarithmic power capability allows the entire dynamic range to be viewed at one time or a small region to be expanded up to 0.1 dB/division for detailed analysis. Likewise, the probability scale can be expanded up to 0.1%/division. Both scales can be offset over their full range to bring any portion of the magnified CDF into view. For every possible power level (p) within the total dynamic range, the CDF shows the probability in percent that the measured power is less than or equal to p. The maximum power level during the entire run will appear at 100% probability.
The adjustable markers allow the power to be read at any probability value along the curve, interpolating to a resolution of 0.01%. Adjustable reference lines allow the probability to be read for any power level to a resolution of 0.01 dBm. Summary results are continually updated and appear at the top of the display, as follows:
- Peak Power
- Average Power
- Peak-to-Average Ratio
- Total Elapsed Time
- Total Number of Samples
- Tolerance
- Reference Line Value
Alternatively, a TEXT display may be selected to display the above in addition to the following:
- Minimum Power
- Dynamic Range
- Confidence
- Marker Position and Value
- Reference Line Position and Value
When the second channel is installed, the CDFs for the two channels can be compared using the Math channel. CDFs can also be saved into REF1 and REF2 and to the floppy disk. The confidence level of the CDF is determined by the number of samples taken. For many purposes, useful results are obtained in just a few seconds of run time. For events with a low probability of occurrence, the run time must be increased to ensure capture.
COMPLEMENTARY CUMULATIVE DISTRIBUTION FUNCTION
The same histogram data can be used to display the complement of the CDF or CCDF, which is also called the 1-CDF because of the manner in which it is calculated. For every possible power level (p) within the totally dynamic range, the CCDF shows the probability in percent that the measured power is greater than p. This definition flips the CDF curve from left to right placing the maximum power value on the zero percentage axis. This form is often more convenient to use, but contains the same information as the CDF.
 |  |
| CCDF of 8 carriers spaced 700 kHz apart from 1.8 GHz to 1.8049 GHz and phase aligned for highest peak power. | PDF of 8 carriers spaced 700 kHz apart from 1.8 GHz to 1.88049 GHz and phase aligned for highest peak power. |
PROBABILITY DENSITY FUNCTION (PDF)
The cumulative distribution function can be further processed to obtain an approximate probability density function or PDF. The PDF shows the relative occurrence of the various power levels. The probability that the power lies between any two values on the power axis is equal to the integral of the PDF between the two values. When the difference between the two values is equal to zero, the integral of the PDF is also zero. This means that it is not possible to determine the probability of occurrence of a particular power level. Strictly speaking, a discrete array such as the histogram of power values described above does not have a density function. However, it is useful for qualitative analysis to create an approximate PDF from the first-order derivative of the CDF. The process of differentiation exaggerates any errors in the CDF values. For this reason, measurements should always be made from the CDF or CCDF. The PDF is useful for visualizing QAM and other signals that have a finite number of discrete levels. For random noise signals, A Gaussian amplitude distribution will appear as a Rayleigh distribution in the linear power domain.

The TEXT display of measurements for the PDF is the same as for the CDF and CCDF. Adjustable markers and reference lines are also provided; there are no marker measurements in the PDF mode.
| MODEL 4400A & 4500A PERFORMANCE SPECIFICATIONS | |
| Sensor Inputs | |
| Frequency Range | 30 MHz to 40 GHz, selectable1 |
| Pulse Measurement Rage | -40 to +20 dB1 |
| CW Measurement Range | -50 to +20 dB1 |
| Risetime (10 – 90%) | See sensor specifications |
| Single-Shot Bandwidth | 100 kHz (based on 10 samples per pulse) |
| Pulse Repetition Rate | 25 MHz |
| Minimum Pulse Width | 30 ns |
| Vertical Scale | |
| Relative Offset Range | |
| Log | +99.99 dB |
| Linear | 0 to 99 divisions |
| Vertical Scale | |
| Log | 0.1-20 dB/div in 1-2-5 sequence2 |
| Linear | 1 nW -50 MW in 1-2-5 sequence2 |
| Time Base Pulse Mode | |
| Time Base Range | 10 ns to 1 s/div |
| Time Base Accuracy | 0.01% |
| Time Base Resolution | 200 ps |
| Statistical Mode (Model 4500A only) | |
| X-Axis | 0.1, 0.2, 0.5, 1, 2, 5, 10% per division |
| Percent Offset Range | 0 – 99% (x-axis dependent) |
| Percent Resolution | 0.002% |
| Trigger Pulse Mode Only | |
| Trigger Source | Channel 1 internal or external; or Channel 2 internal or external5 |
| Trigger Slope | + or – |
| Pre-Trigger Delay | |
| Time Base Setting | Delay Range |
| 10 ns to 50 µs | -500 µs |
| 100 µs to 1 sec | -10 div |
| Post-Trigger Delay | |
| Time Base Setting | Delay Range |
| 10 ns to 1 µs | 10,000 div |
| 2 µs to 50 µs | 2 ms |
| 100 µs to 1 sec | 200 div |
| Trigger Delay Resolution | 0.02 divisions |
| Trigger Holdoff Range | 65 ms |
| Trigger Holdoff Resolution | 62.5 ns |
| Trigger View | |
| Vertical Scale | 0.1V to 1V in 1-2-5 sequence |
| Relative Offset | +3 volts |
| Internal Trigger Range | -27 to +20 dBm1 |
| External Trigger Range | +3 volts |
| External Trigger Input | 50 ohms, dc coupled |
| Statistical Pricessing (Model 4500A only) CDF, 1-CDF, PDF Modes | |
| Sampling Rate | 500,000 samples per second |
| Number of Sampling Bins | 4,096 |
| Size of Sample Bins | 32 bits |
| Bin Power Resolution | 1 |
| Percent Resolution | CDF, 1-CDF in log or linear scales and plots normalized to average power PDF log or linear scales and plots normalized to average power |
| Automatic Measurements | Peak max. power, average power, peak to average ratio, minimum power, total samples, sampling time, confidence band of measurements, dynamic range, and tolerance |
| Calibration Source | |
| Operating Modes | CW, internal or external pulse |
| Frequency | 1.024 GHz + 0.1% |
| Level Range | -40.0 to +20.0 dBm |
| Resolution | 0.1 dB |
| Output SWR (Refl. Coeff.) | 1.20, (0.091)3 |
| Accuracy (NIST traceable)4 (-30 to +20 dBm) | |
| Absolute | +0.065 (1.5%) at 0 dB and 25OC, +0.001 dB per OC |
| Linearity | +0.03 dB per 5 dB |
| Internal Pulse Period | 100 µs, 1 ms or 10 ms |
| Internal Pulse Duty Cycle | 10% to 90% in 10% increments |
| Internal/External | |
| Pulse Polarity | + or – |
| Connector Type | N |
| Power Measurement Accuracy | |
| Measurement Uncertainty | Total measurement uncertainty (worst case) is the sum of the calibrator uncertainty, source mismatch error, sensor calibration factor uncertainty, sensor temperature coefficient, sensor shaping, noise and drift. |
| Mismatch Uncertainty | +2 x sensor reflection coefficient x source reflection coefficient x 100% |