No products
Product successfully added to your shopping cart
There are 0 items in your cart. There is 1 item in your cart.
EMC Receivers/EMI Analyzers
- EMC Test Equipment
- Transient Generators
- RF Power Amplifiers
- DC - 300 kHz RF Amplifiers
- 10 kHz - 250 MHz RF Amplifiers
- 10 kHz - 400 MHz RF Amplifiers
- 10 kHz - 1 GHz RF Amplifiers
- 80 MHz - 1 GHz RF Amplifiers
- 1 GHz - 2 GHz RF Amplifiers
- 700 MHz - 4.2 GHz RF Amplifiers
- 1 GHz - 6 GHz RF Amplifiers
- 2 GHz - 8 GHz RF Amplifiers
- 6 GHz - 18 GHz RF Amplifiers
- 18 GHz - 40 GHz RF Amplifiers
- Pulse Amplifiers
- RF Field Strength Probes & Meters
- RF Conducted Immunity
- EMC Receivers/EMI Analyzers
- EMC Antennas
- Coupling Decoupling Networks (CDN's)
- Line Impedance Stabilization Networks (LISN's)
- RF Test Equipment
- EMC Probes
- EMC Measurement & Equipment Software
- Power Supplies
- Electrical Safety Analyzers
- High Precision Laboratory Power Analyzers & Meters
- Anechoic Chambers
- Over-the-Air (OTA) Test Chambers
- EMI RF Shielded Tent Enclosures
- RF Shielded Rooms
- EMC Absorber
- Positioning Equipment
- EMC/EMI Test Setup
- GTEM Cells / TEM Cells
- Reverberation Chambers
- Used RF Anechoic Chambers
- EMC Chamber Filters
- EMC Chamber Shielding Gaskets
- RF Shielded Doors
- Anechoic Chamber Accessories
- Fully Anechoic (FAR) Test Chambers
- Manufacturers
- 3ctest
- AE Techron
- AH Systems
- Amplifier Research
- Boonton
- Com-Power
- Diamond Engineering
- EM Test (Ametek CTS)
- EMC Partner
- EMC Test Design
- Empower High Power RF Amplifiers
- ETS-lindgren
- Log Periodic Dipole Array Antenna
- Near Field Probe Sets
- Double Ridge Horn Antennas
- Biconical Antennas
- Quad Ridge Horn Antennas
- Electric Field Probes
- GTEM's
- Positioners & Tripods
- Loop Antennas
- Biconilog Antennas
- LISN's (Line Impedance Stabilization Network)
- Shielded Enclosures/Rooms
- Monopole Antennas
- Field Generating Antennas
- Fischer Custom Communications
- Haefely Hipotronics
- Haefely EFT/Burst Immunity Test Systems
- Haefely Surge Combination Wave Test Systems
- Haefely Surge Damped Oscillating Wave Test Systems
- Haefely Electrostatic Discharge Test Systems (ESD)
- Haefely Surge Ring Wave Test Systems
- Haefely Surge Telecom Wave Test Systems
- Haefely Magnetic Field Test Systems
- Haefely CDN's (Coupling/Decoupling Networks)
- IFI Amplifiers
- Keysight (Agilent)
- MVG - Microwave Vision Group
- PMM / Narda
- Rohde & Schwarz RF Test Equipment
- Rohde & Schwarz Broadband RF Amplifiers
- Rohde & Schwarz Spectrum Analyzers
- Rohde & Schwarz Compliant EMI Test Receivers
- Rohde & Schwarz Isotropic RF Probes
- Rohde & Schwarz RF Signal Generators
- Rohde & Schwarz RF Switches
- Rohde & Schwarz Oscilloscopes
- Rohde & Schwarz RF Power Meters
- Rohde & Schwarz RF Power Sensors
- Schloder
- Schwarzbeck Mess-Elektronik
- Schwarzbeck Antennas
- Schwarzbeck Automotive Antennas
- Schwarzbeck Broadband Horn Antennas
- Schwarzbeck Biconical Antennas
- Schwarzbeck Logarithmic Periodic Broadband Antennas
- Schwarzbeck Stacked Log-Periodic Broadband Antennas
- Schwarzbeck Biconic Log-Periodic Antennas
- Schwarzbeck Dipole Antennas
- Schwarzbeck Rod Antennas
- Schwarbeck Antenna Baluns / Holders
- Schwarzbeck LISN Line Impedance Stabilisation Networks
- Schwarbeck Decoupling & Absorbing Clamps
- Schwarzbeck Field Probes
- Schwarzbeck Helmholtz Coils
- Schwarzbeck Antenna Masts
- Schwarzbeck Coupling/Decoupling Networks
- Schwarzbeck Antennas
- Solar Electronics
- Teseq (Schaffner)
- Teseq Automotive Transient Generators
- Teseq RF Test Equipment
- Teseq EFT/Burst Generators
- Teseq RF Immunity Generators
- Teseq ESD Guns
- Teseq Surge Generators
- Teseq Harmonics & Flicker Solutions
- Teseq Dips, Interrupts & Variations Equipment
- Teseq Ring Wave Generators
- Teseq Oscillatory Waves Generators
- Teseq Absorbing Clamps / Ferrite Tube
- Teseq EMC Antennas
- Teseq Current Probes
- Teseq Coupling Networks
- Thermo Keytek
- Vicreate
- Compliance Standards
- International (IEC/EN)
- EN/IEC 61000-3-2
- EN/IEC 61000-3-3
- IEC 61000-3-11
- IEC / EN 610000-3-12
- EN/IEC 61000-4-2
- EN/IEC 61000-4-3
- EN/IEC 61000-4-4
- EN/IEC 61000-4-5
- EN/IEC 61000-4-6
- EN/IEC 61000-4-7
- EN/IEC 61000-4-8
- EN/IEC 61000-4-9
- EN/IEC 61000-4-10
- EN/IEC 61000-4-11
- EN/IEC 61000-4-12
- EN/IEC 61000-4-16
- EN/IEC 61000-4-18
- EN/IEC 61000-4-19
- EN/IEC 61000-4-20
- EN/IEC 61000-4-21
- EN/IEC 61000-4-29
- EN/IEC 61000-4-31
- IEC 61000-4-39
- EN/IEC 62132
- SEMI F47 Voltage Sag Immunity
- Product Standards
- Military & Aerospace Standards
- Automotive EMC Standards
- CISPR Standards
- Telecom Testing
- ANSI/IEEE Standards
- FCC Part 15
- FCC Part 30
- International (IEC/EN)
- Application/Test Type
- Radiated Immunity
- Bulk Current Injection Testing
- RF Emissions Testing
- Conducted Immunity
- Conducted Emissions
- Antenna Pattern Measurement
- CE Mark Testing
- Intentional Radiator Testing
- Pulsed HIRF Radar
- Over-the-Air (OTA) Testing
- 5G Test Solutions
- Automotive EMC
- SAR Measurement Equipment
- Radiated Emissions
- Battery Simulator Test Equipment
- Services
- Clearance
Viewed products
-

Rohde & Schwarz...
Frequency range: 5 kHz to 1 GHz,...
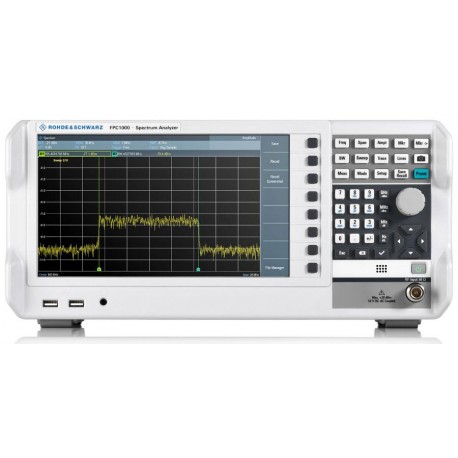
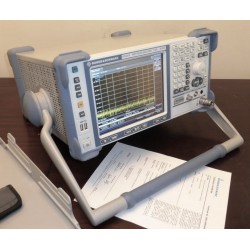
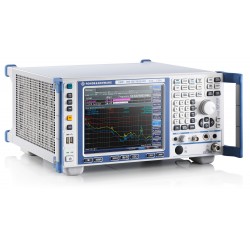
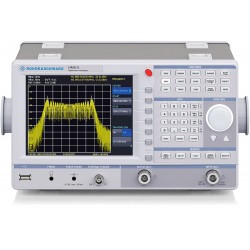
Rohde & Schwarz FPC1000 Low-Cost Spectrum Analyzer for Emissions Testing
Refurbished
- Frequency range: 5 kHz to 1 GHz, Upgradable to 2 GHz or 3 GHz
- Resolution bandwidth settings down to 1 Hz
- 10.1" WXGA (1366 x 768 pixel) display
- Wi-Fi-enabled w/ remote control (included)
- Easy virtual control w/ iOS/Android/PC
- Low noise floor / High max. input power
- Receiver mode for EMI debugging on circuit boards, integrated circuits, cable shielding, etc.
- Three-year warranty
Typically In Stock
PDF Downloads
Test Equipment Description
Investment protection, high resolution and easy virtual control. These characteristics make the R&S®FPC1000 spectrum analyzer the perfect tool for university laboratories, basic research as well as production and service facilities. Investment protection through software upgrade capability. The R&S®FPC1000 base instrument has a frequency range of 5 kHz to 1 GHz. Keycode options unlock higher frequency ranges up to 3 GHz or enable other features when required.
Class-leading RF performance engineered in Germany. Extraordinarily low noise floor and high max. input power combine to provide for the best dynamic range in its class. Resolution bandwidth settings to 1 Hz resolve finer spectral details than any other spectrum analyzer in this class.
See more details with high resolution. The R&S®FPC1000 features the largest and most detailed display in its class at 10.1", WXGA (1366 × 768 pixel) resolution. The display is 26 % larger and has a 160 % higher resolution than other instruments.
Virtual control enables remote control and measurement. The R&S®FPC1000 supports wired Ethernet and wireless Wi-Fi connectivity. R&S®InstrumentView for Windows as well as the iOS/Android app-based R&S®MobileView platforms enable remote control and measurement anytime, anywhere.
10.1" High-Resolution Display

Investment protection
Fully frequency-upgradeable
Buy only what is needed. The R&S®FPC1000 is futureviable thanks to the unique Rohde & Schwarz upgrade path. The base unit covers a frequency range from 5 kHz to 1 GHz, with keycode-activated upgrades available. Effortlessly step up to higher frequency applications with upgrades to 2 GHz or even 3 GHz without additional calibration.
100 % Software-Upgradeable
Buy as needed. Shipping instruments for feature upgrade is inconvenient for rack-integrated measurement setups. The R&S®FPC1000 can be upgraded by simply entering a software keycode. All options are in place and can be enabled by the user. Upgrade effortlessly and conveniently.
No Downtime – instant option availability
Buy when needed. The unique Rohde & Schwarz upgrade path eliminates the need for additional upgrade calibration. Avoid delays and downtime and instantly access additionally required functionality.
Unexpected RF performance
Low Noise Floor
High sensitivity is critical in many applications, e.g. when measuring extremely weak signals. The R&S®FPC1000 provides an extraordinarily low noise floor of –150 dBm (typ.). Add the optional R&S®FPC1000-B22 preamplifier to increase sensitivity even further down to –165 dBm (typ.).
High Max. Input Power
Measure 10 times more power with the R&S®FPC1000. Most entry level spectrum analyzers can measure up to +20 dBm (100 mW). The R&S®FPC1000 is capable of measuring high power signals of up to +30 dBm (1 W). The combination of low noise floor and high max. input power provides exceptionally wide measurement dynamic range in the R&S®FPC1000.
High resolution
160 % Higher Display Resolution
Higher resolution. The WXGA panel (1366 × 768 pixel) exceeds the VGA resolution (640 × 480 pixel) that had been standard among entry level spectrum analyzers by 160 %. Inspect measured signals in unprecedented clarity and razor-sharp detail.
26% Larger Display
See more. The R&S®FPC1000 has the largest display of any entry level spectrum analyzer. The new 26 cm (10.1") panel is 26 % larger than the display of other entry class spectrum analyzers (20 cm or 8"). The combination of high display resolution and a large display creates extraordinary user experience. Examine more measured signal on the instrument screen.
1 Hz Resolution Bandwidth
More details. The quality of RF measurements strongly depends on suitable resolution bandwidth settings. Finer resolution bandwidth means more spectral details. The R&S®FPC1000 is the only entry level spectrum analyzer with resolution bandwidth settings down to 1 Hz. Identify RF signal details with class-unprecedented measurement frequency resolution. Innovate with a large, high-resolution display and fine resolution bandwidth. Experience unexpected performance in the entry class.

The high dynamic range of the R&S®FPC1000 fully utilizes the 10.1" WXGA display.
Easy Virtual Control
First Wi-Fi-enabled spectrum analyzer in its class
Eliminate network cables with integrated wireless technology. The R&S®FPC1000 is Wi-Fi enabled 1) and wirelessly connects to Wi-Fi access points. This renders Ethernet cables, plugs, hubs and installation superfluous.
Innovative control – fast and easy with iOS/ Android/PC software
User in focus. Simple and intuitive controls are gamechanging trends in industry. The R&S®FPC1000 connects to R&S®InstrumentView as well as to R&S®MobileView remote control platforms via USB 2), Ethernet or Wi-Fi.
R&S®InstrumentView (PC software) and R&S®MobileView (iOS/Android app) are powerful all-in-one remote control applications that come bundled with the R&S®FPC1000 3).
Take control, read measurements, save and transfer measurement settings – quickly and easily via a PC, laptop, mobile phone or tablet from any network location.
1. Wi-Fi feature not available in some countries due to local certification requirements.
2. R&S®InstrumentView only.
3. Incorporates R&S®FPH, R&S®ZPH, R&S®FSH and R&S®ZVH interfaces.

R&S®InstrumentView remote control software.
Lab feature in R&S®InstrumentView – set up a wireless remote lab in minutes
R&S®InstrumentView supports a specific feature called Lab that can help instructors use the R&S®FPC1000 Wi- Fi capabilities to set up a wireless student lab in minutes. They can then use the R&S®InstrumentView Lab feature to simultaneously control, synchronize and view multiple instruments.
Professors can conveniently manage, assist and monitor student measurements from a central or remote location using the R&S®InstrumentView Lab feature. This feature is also beneficial in any scenario where remote monitoring of multiple instruments is required.
Virtual classroom concept – flexible deployment of classrooms anywhere, anytime
Student benefit. In a globalized world, education breaks geographic barriers. The R&S®FPC1000 with its wireless connectivity combined with the R&S®InstrumentView Lab feature is a unique tool for virtual classroom concepts and location-independent teaching.
Students can easily connect to a common network domain from anywhere in the world to participate in lab classes or online lab assessments. Experience teaching anywhere, anytime.
| R&S InstrumentView and R&S MobileView features | ||
| R&S®InstrumentView | R&S®MobileView | |
| Easy and fast exchange of screenshots and configurations between the instrument and a PC | ● | - |
| Remote control of the instrument from any network location | ● | ● |
| Easy creation of test reports in PDF, HTML and RTF formats | ● | - |
| Easy processing of measurement results | ● | - |
| Editing of measuring results by displaying/hiding/shifting markers and limit lines, etc | ● | - |
| PC (MS Windows) compatible | ● | - |
| iOS/Android compatible | - | ● |
| iOS/Android compatible | ● | ● |
Software applications and features
Receiver mode
The R&S®FPC1000 offers the optional R&S®FPC-K43 receiver mode for EMI debugging on circuit boards, integrated circuits, cable shielding and more. The R&S®FPC-B22 preamplifier compensates for coupling loss of probes and increases sensitivity to detect small interfering signals.
Use the R&S®FPC1000 as a cost-effective yet powerful tool to analyze and locate disturbance sources during development.

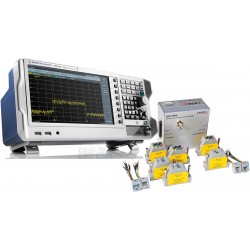
R&S®FPC1000 spectrum analyzer with the R&S®HZ-15 probe set and DUT.
Modulation Analysis
The R&S®FPC-K7 converts the R&S®FPC1000 into a modulation analyzer for measuring the modulation quality of amplitude or frequency-modulated signals.
The analog demodulation display shows the waveform as well as a summary of measurement parameters such as carrier power, carrier offset, modulation index (depth) for AM signals, frequency deviation for FM signals, SINAD, THD, etc. The modulation summary display provides user-definable limits for each measurement. Demodulated audio is supported via the built-in speaker or the headphone
Basic digital modulation formats are used with many applications, e.g. near-field communications. The R&S®FPC1000 supports both ASK and FSK analysis. The digital modulation displays include trace, eye diagram, modulation error and symbol analysis. 1)
Easily verify the quality of the basic modulated signals with the R&S®FPC-K7 software option.
Advanced Measurements
Step up measurements. The R&S®FPC-K55 adds functions for measuring channel power, occupied bandwidth, adjacent channel leakage ratio (ACLR), spectral emission mask (SEM), spurious emissions and third order intercept (TOI). It even provides a spectrogram display to provide easy insight into spectrum occupancy and time-varying signals. 2)
Experience advanced measurements on an entry level instrument.
1) Analog modulation analysis available at product launch. Digital modulation analysis will follow via firmware update at a later stage.
2) Channel power, occupied bandwidth and spectrogram available at product launch. ACLR, SEM, spurious emissions and TOI will follow via firmware update at a later stage.
| Rohde & Schwarz FPC1000 Specifications | ||
| Frequency range | R&S®FPC1000 | 5 kHz to 1 GHz |
| with R&S®FPC-B2 option | 5 kHz to 2 GHz | |
| with R&S®FPC-B3 option | 5 kHz to 3 GHz | |
| Frequency resolution | 1 Hz | |
| Reference frequency, internal | ||
| Aging per year | 1 × 10⁻⁶ | |
| Temperature drift | 0 °C to +30 °C | 1 × 10⁻⁶ |
| +30 °C to +50 °C | 3 × 10⁻⁶ | |
| Achievable initial calibration accuracy | 5 × 10⁻⁷ | |
| Total reference uncertainty | (time since last adjustment × aging rate) + temperature drift + calibration accuracy | |
| Frequency readout | ||
| Marker resolution | 0.1 Hz | |
| Uncertainty | ±(marker frequency × reference uncertainty + 10 % × resolution bandwidth + ½ (span / (sweep points – 1)) + 1 Hz) | |
| Number of sweep (trace) points | 1183 | |
| Marker tuning frequency step size | span/1182 | |
| Frequency counter resolution | 0.1 Hz | |
| Count uncertainty | SNR > 25 dB | ±(frequency × reference uncertainty + ½ (last digit)) |
| Frequency span | 0 Hz, 10 Hz to 1 GHz | |
| with R&S®FPC-B2 option | 0 Hz, 10 Hz to 2 GHz | |
| with R&S®FPC-B3 option | 0 Hz, 10 Hz to 3 GHz | |
| Span uncertainty | 1 % (nom.) | |
| Spectral purity SSB phase noise | f = 500 MHz | |
| Carrier offset | 30 kHz | < –88 dBc (1 Hz), –92 dBc (1 Hz) (typ.) |
| 100 kHz | < –98 dBc (1 Hz), –103 dBc (1 Hz) (typ.) | |
| 1 MHz | < –120 dBc (1 Hz), –125 dBc (1 Hz) (typ.) | |
| Sweep time | ||
| Sweep time | span = 0 Hz | 100 μs to 100 s |
| 10 Hz ≤ span ≤ 600 MHz | 10 ms to 1000 s | |
| span > 600 MHz | 10 ms × span/600 MHz to 1000 s | |
| Uncertainty | span = 0 Hz | 1 % (nom.) |
| span ≥ 10 Hz | 3 % (nom.) | |
| Bandwidth | ||
| Range | -3 dB bandwidth | 1 Hz to 3 MHz in 1/3 sequence |
| Bandwidth accuracy | 1 Hz ≤ RBW ≤ 300 kHz | < 5 % (nom.) |
| 300 kHz < RBW ≤ 1 MHz | < 10 % (nom.) | |
| Selectivity 60 dB:3 dB | < 5 (nom.) (Gaussian type filters) | |
| Video filters | ||
| Range | -3 dB bandwidth | 1 Hz to 3 MHz in 1/3 sequence |
| Level | ||
| Display range | displayed noise floor to +30 dBm | |
| Maximum rated input level | ||
| DC voltage | 50 V | |
| CW RF power | 33 dBm (= 2 W) | |
| Peak RF power | duration < 3 s | 36 dBm (= 4 W) |
| Max. pulse voltage | 150 V | |
| Max. pulse energy | pulse width 10 μs | 10 mWs |
| Intermodulation | ||
| Third-order intercept (TOI) | intermodulation-free dynamic range, signal level 2 × –20 dBm, RF attenuation = 0 dB, RF preamplifier = off | |
| fin = 1 GHz | +7 dBm (meas.) | |
| fin = 2.4 GHz | +10 dBm (meas.) | |
| Second harmonic intercept (SHI) | RF attenuation = 0 dB, RF preamplifier = off, signal level = –40 dBm | |
| fin = 20 MHz to 1.5 GHz | –60 dBc (nom.) | |
| Displayed average noise level | dB RF attenuation, termination 50 Ω, RBW = 100 Hz, VBW = 10 Hz, sample detector, log scaling, normalized to 1 Hz | |
| preamplifier R&S®FPC1000 = off | ||
| 1 MHz to 10 MHz | < –127 dBm,–135 dBm (typ.) | |
| 10 MHz to 2 GHz | < –142 dBm, –150 dBm (typ.) | |
| 2 GHz to 3 GHz | < –138 dBm, –147 dBm (typ.) | |
| preamplifier R&S®FPC1000 = on (requires R&S®FPC-B22 option) | ||
| 1 MHz to 10 MHz | < –147 dBm, –157 dBm (typ.) | |
| 10 MHz to 2 GHz | < –158 dBm, –165 dBm (typ.) | |
| 2 GHz to 3 GHz | < –155 dBm, –163 dBm (typ.) | |
| Immunity to interference, nominal values | ||
| Image frequencies | fin – 2 × 30.15 MHz | < –70 dBc (nom.) |
| fin – 2 × 830.15 MHz | < –65 dBc (nom.) | |
| fin – 2 × 4042.65 MHz | –60 dBc (nom.) | |
| Intermediate frequencies | 30.25 MHz, 830.25 MHz, 4042.65 MHz | < –70 dBc (nom.) |
| Other interfering signals, signal level – RF attenuation < –30 dBm | spurious at fin – 2021.325 MHz | < –60 dBc (nom.) |
| Other interfering signals, related to local oscillators | Δf ≥ 300 kHz | < –60 dBc (nom.) |
| f = receive frequency | ||
| Residual spurious response | input matched with 50 Ω, without input signal, RBW ≤ 30 kHz, f ≥ 3 MHz, RF attenuation = 0 dB, Wi-Fi function disabled | < –90 dBm (nom.) |
| Level Display | ||
| Logarithmic level axis | 1/2/5/10/20/50/100 dB, 10 divisions | |
| Linear level axis | 0 % to 100 %, 10 divisions | |
| Number of traces | 2 | |
| Trace detectors | max. peak, min. peak, auto peak, sample, RMS | |
| Trace functions | clear/write, max. hold, min. hold, average, view | |
| Setting range of reference level | -130 dBm to +30 dBm | |
| Units of level axis | dBm, dBmV, dBμV, V, W | |
| Level measurement uncertainty | ||
| Absolute level uncertainty at 100 MHz | +20 °C to +30 °C | < 0.3 dB |
| Frequency response (+20 °C to +30 °C) | 100 kHz ≤ f < 10 MHz | < 1.5 dB (nom.) |
| 10 MHz ≤ f ≤ 3 GHz | < 1 dB | |
| Attenuator uncertainty | < 0.3 dB | |
| Uncertainty of reference level setting | < 0.1 dB (nom.) | |
| Display nonlinearity | SNR > 16 dB, 0 dB to –50 dB, logarithmic level display | < 0.3 dB |
| Bandwidth switching uncertainty | reference: RBW = 10 kHz | < 0.1 dB (nom.) |
| Total measurement uncertainty | 95 % confidence level, +20 °C to +30 °C, SNR > 16 dB, 0 dB to –50 dB below reference level, RF attenuation auto | |
| 10 MHz ≤ f ≤ 3 GHz | < 1.25 dB, 0.5 dB (typ.) | |
| Trigger Functions | ||
| Trigger source | free run, video, external | |
| External trigger level threshold | low → high transition | 2.4 V |
| high → low transition | 0.7 V | |
| maximum | 3.0 V | |
| Inputs and Outputs | ||
| Impedance | 50 Ω (nom.) | |
| Connector | N female | |
| VSWR | 5 kHz ≤ f ≤ 1 GHz | < 1.5 (nom.) |
| 1 GHz < f ≤ 3 GHz | < 2 (nom.) | |
| Input attenuator | RF input only | 0 dB to 40 dB in 5 dB steps |
| AF Output | ||
| AF demodulation types | AM and FM | |
| Connector | 3.5 mm mini jack | |
| Output impedance | 32 Ω (nom.) | |
| Voltage (open circuit) | VRMS adjustable from 0 V to > 100 mV | |
| External reference, external trigger | ||
| Connector | BNC, 50 Ω | |
| Mode | ext. reference, ext. trigger | |
| External reference | required level | 0 dBm |
| Frequency | 10 MHz | |
| External trigger threshold | low → high transition | 2.4 V |
| high → low transition | 0.7 V | |
| General Data | ||
| Power supply | ||
| AC supply | input specifications | 100 V to 240 V AC, 50 Hz to 60 Hz, 0.6 A to 0.4 A |
| Power consumption | 14 W (nom.) | |
| Safety | IEC 61010-1, EN 61010-1, UL 61010-1, CAN/CSA-C22.2 No. 61010.1 | |
| Test mark | VDE, GS, CSA | |
| Manual Operation | ||
| Languages | Chinese, English, French, German, Italian, Hungarian, Japanese, Korean, Portuguese, Russian, Spanish | |
| Remote Control | ||
| Command set | SCPI 1997.0 | |
| LAN interface | 10/100BASE-T, RJ-45 | |
| USB | type B plug, version 2.0 | |
| Display | ||
| Size | 10.1" | |
| Resolution | 1366 × 768 pixel | |
| Pixel errors | < 2 pixel | |
| Audio | ||
| Speaker | internal | |
| USB interface | type A plug, version 2.0 | |
| number of interfaces | 2 | |
| Mass memory | memory stick (not supplied), size ≤ 4 Gbyte, USB version 1.1 or 2.0 | |
| Data storage | internal | > 256 instrument settings and traces |
| on memory stick, ≥ 1 Gbyte | > 5000 instrument settings and traces | |
| Environmental Conditions | ||
| Temperature | operating temperature range | +10 °C to +40 °C |
| storage temperature range | -20 °C to +70 °C | |
| Climatic loading | relative humidity | +25 °/+40 °C at 85 % relative humidity in line with EN 60068-2-30 |
| >Mechanical Resistance | ||
| Vibration | sinusoidal | EN 60068-2-6 |
| random | EN 60068-2-64 | |
| Shock | 40 g shock spectrum, in line with MIL-STD-810F, method 516.4 procedure 1, EN 60068-2-27 | |
| EMC | in line with European EMC Directive 2004/108/EC including CISPR 11/EN 55011/group 1 class A (emission) EN 61326 table 2 (immunity, industrial) | |
| Dimensions (W × H × D) | without feet | 396 mm × 178 mm × 147 mm (15.6 in × 7 in × 5.8 in) |
| including feet | 396 mm × 185 mm × 156 mm (15.6 in × 7.3 in × 6.1 in) | |
| Weight | 3 kg (6.61 lb) | |
| Recommended calibration interval | 1 year | |

